Bike Facts
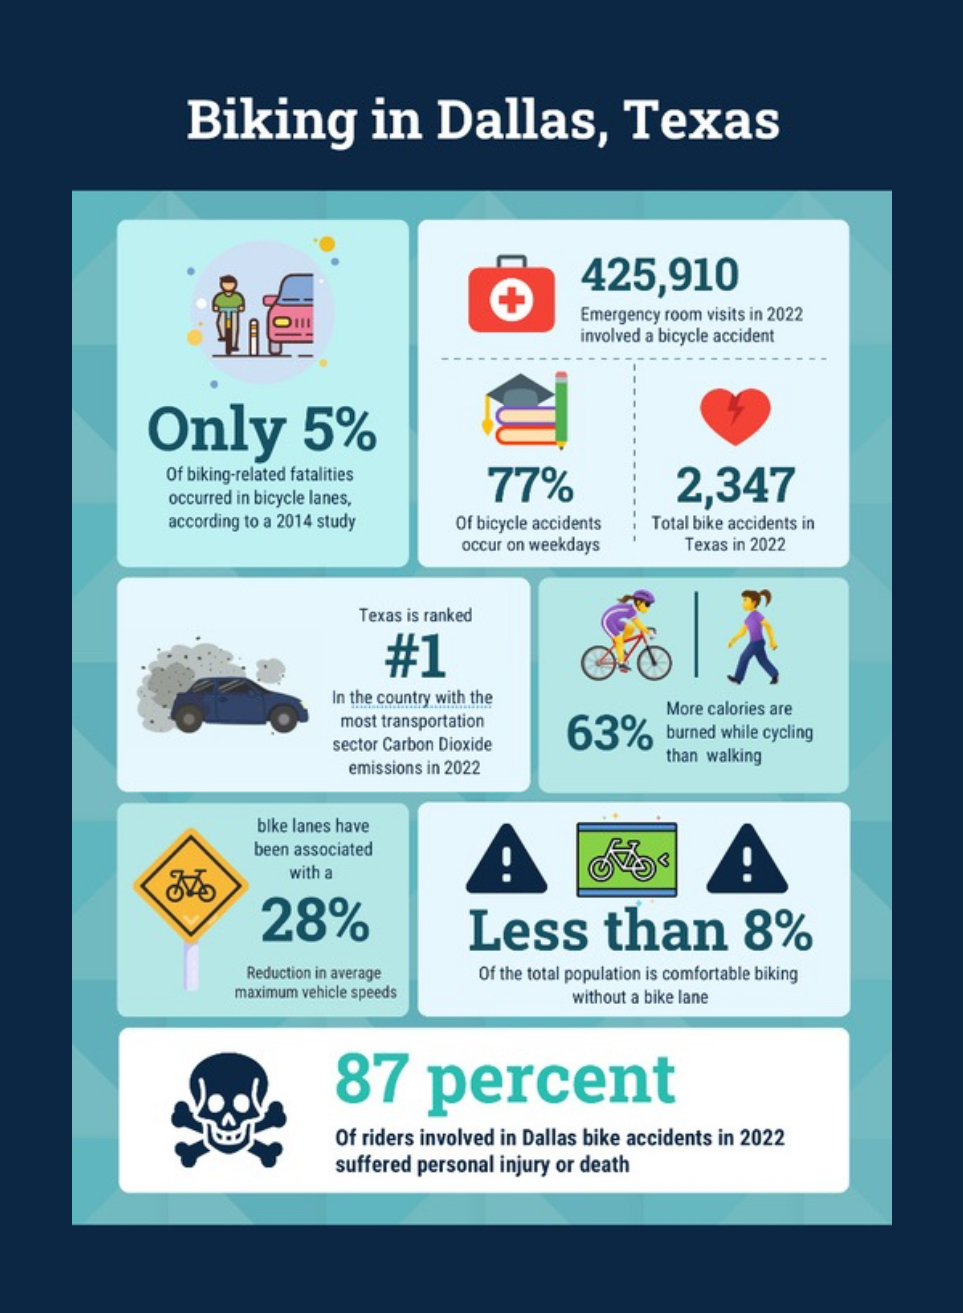
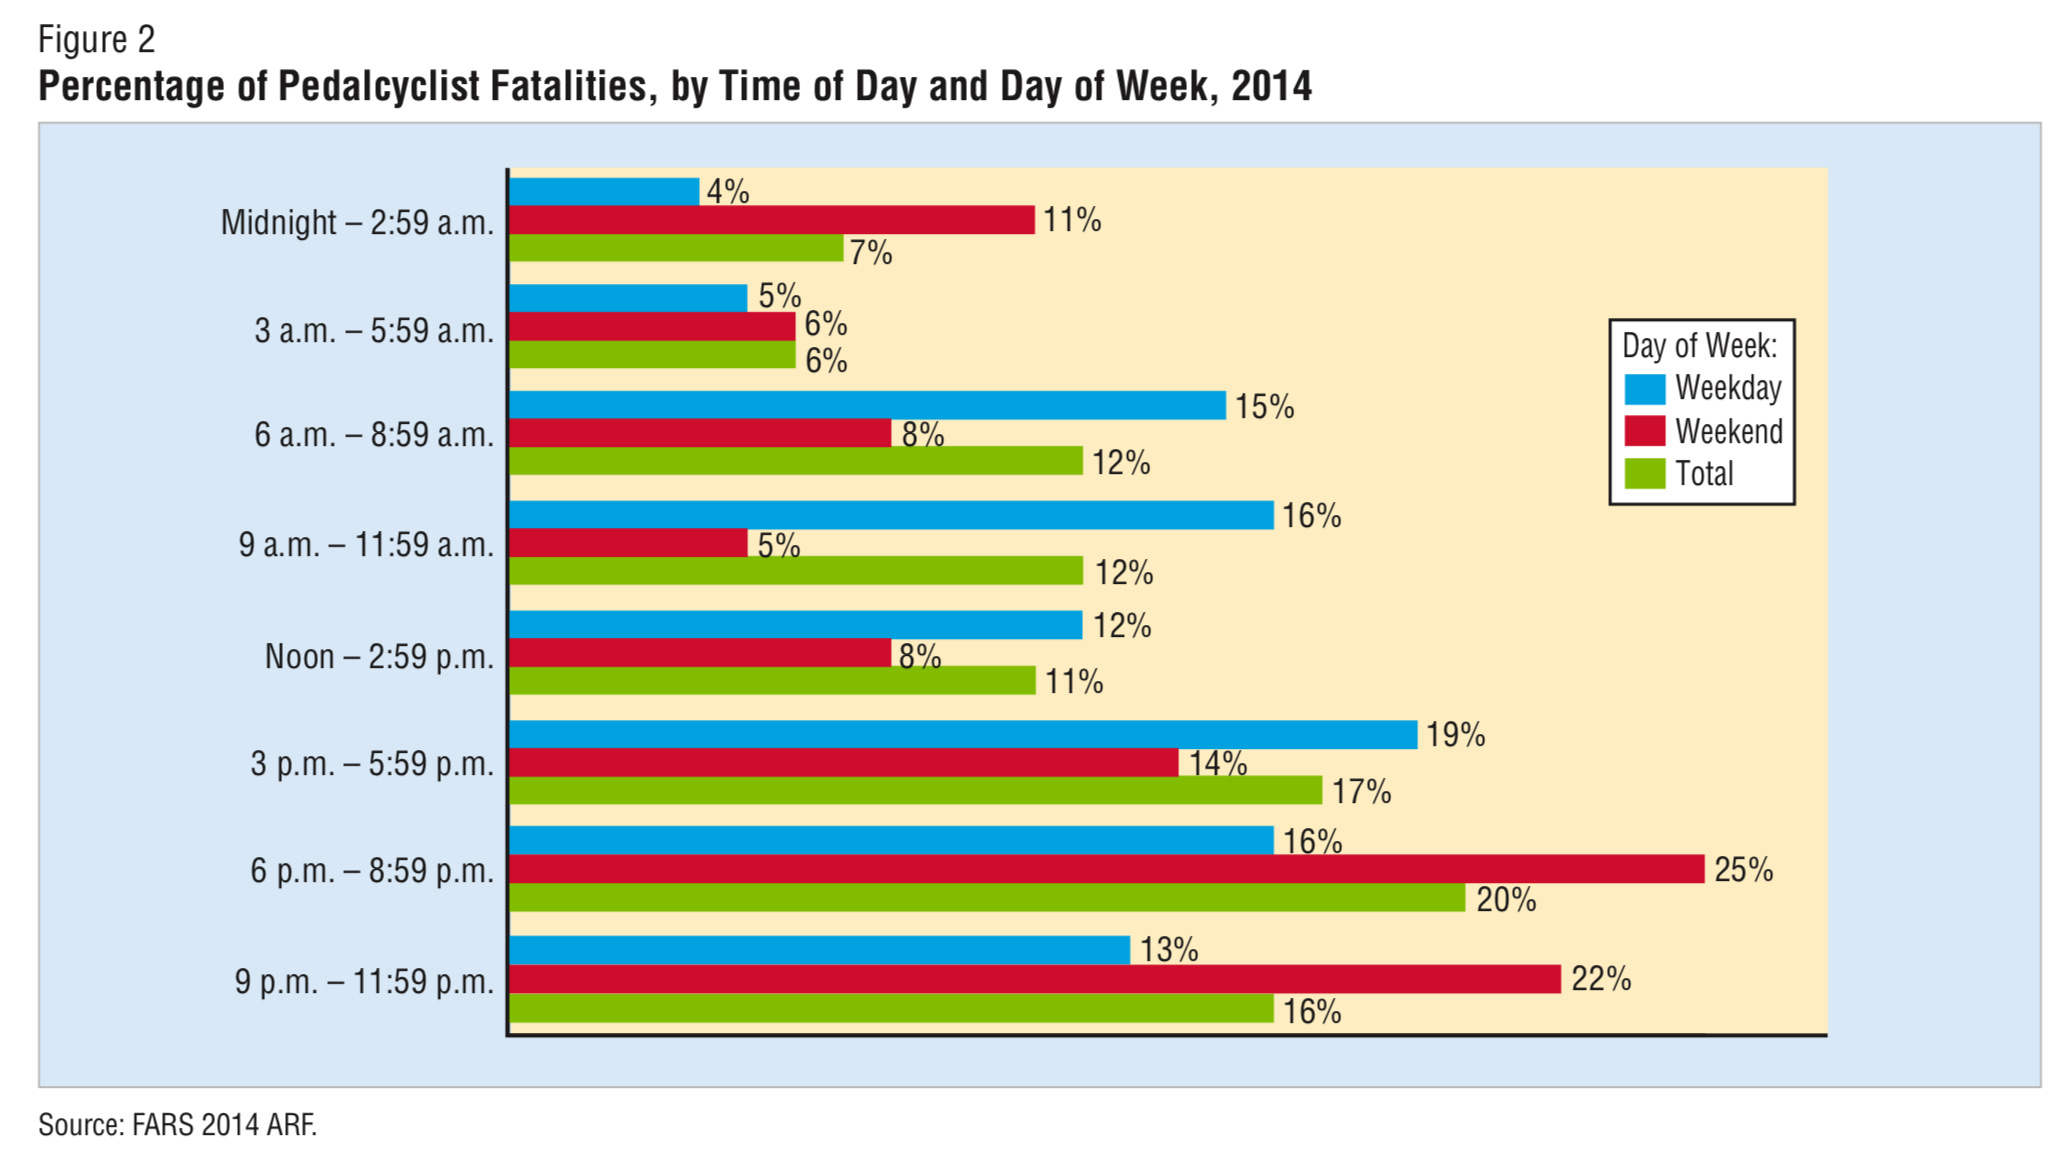
There were 118 crashes between bicycles and motorized vehicles in 2022 in Dallas, which is 4.2% of total Texas bicycle crashes. Five cyclists died from fatal injuries within 30 days of their accident; twenty-two sustained serious, incapacitating injuries requiring an ambulance; forty-seven experienced visible but not incapacitating wounds; and twenty-eight had possible, non-visible injuries with symptoms. This left only fifteen cyclists unharmed from crashes. This means that in 2022, over 87% of cyclists in accidents suffered from injuries or death.
Consumer Product Safety Commission's 2020 report stated that 425,910 emergency room visits involved bicycles due to accidents and intentional injuries.
71% of cyclist fatalities occurred in urban areas. Half were during the day, and a bit over half occurred at non-intersections.
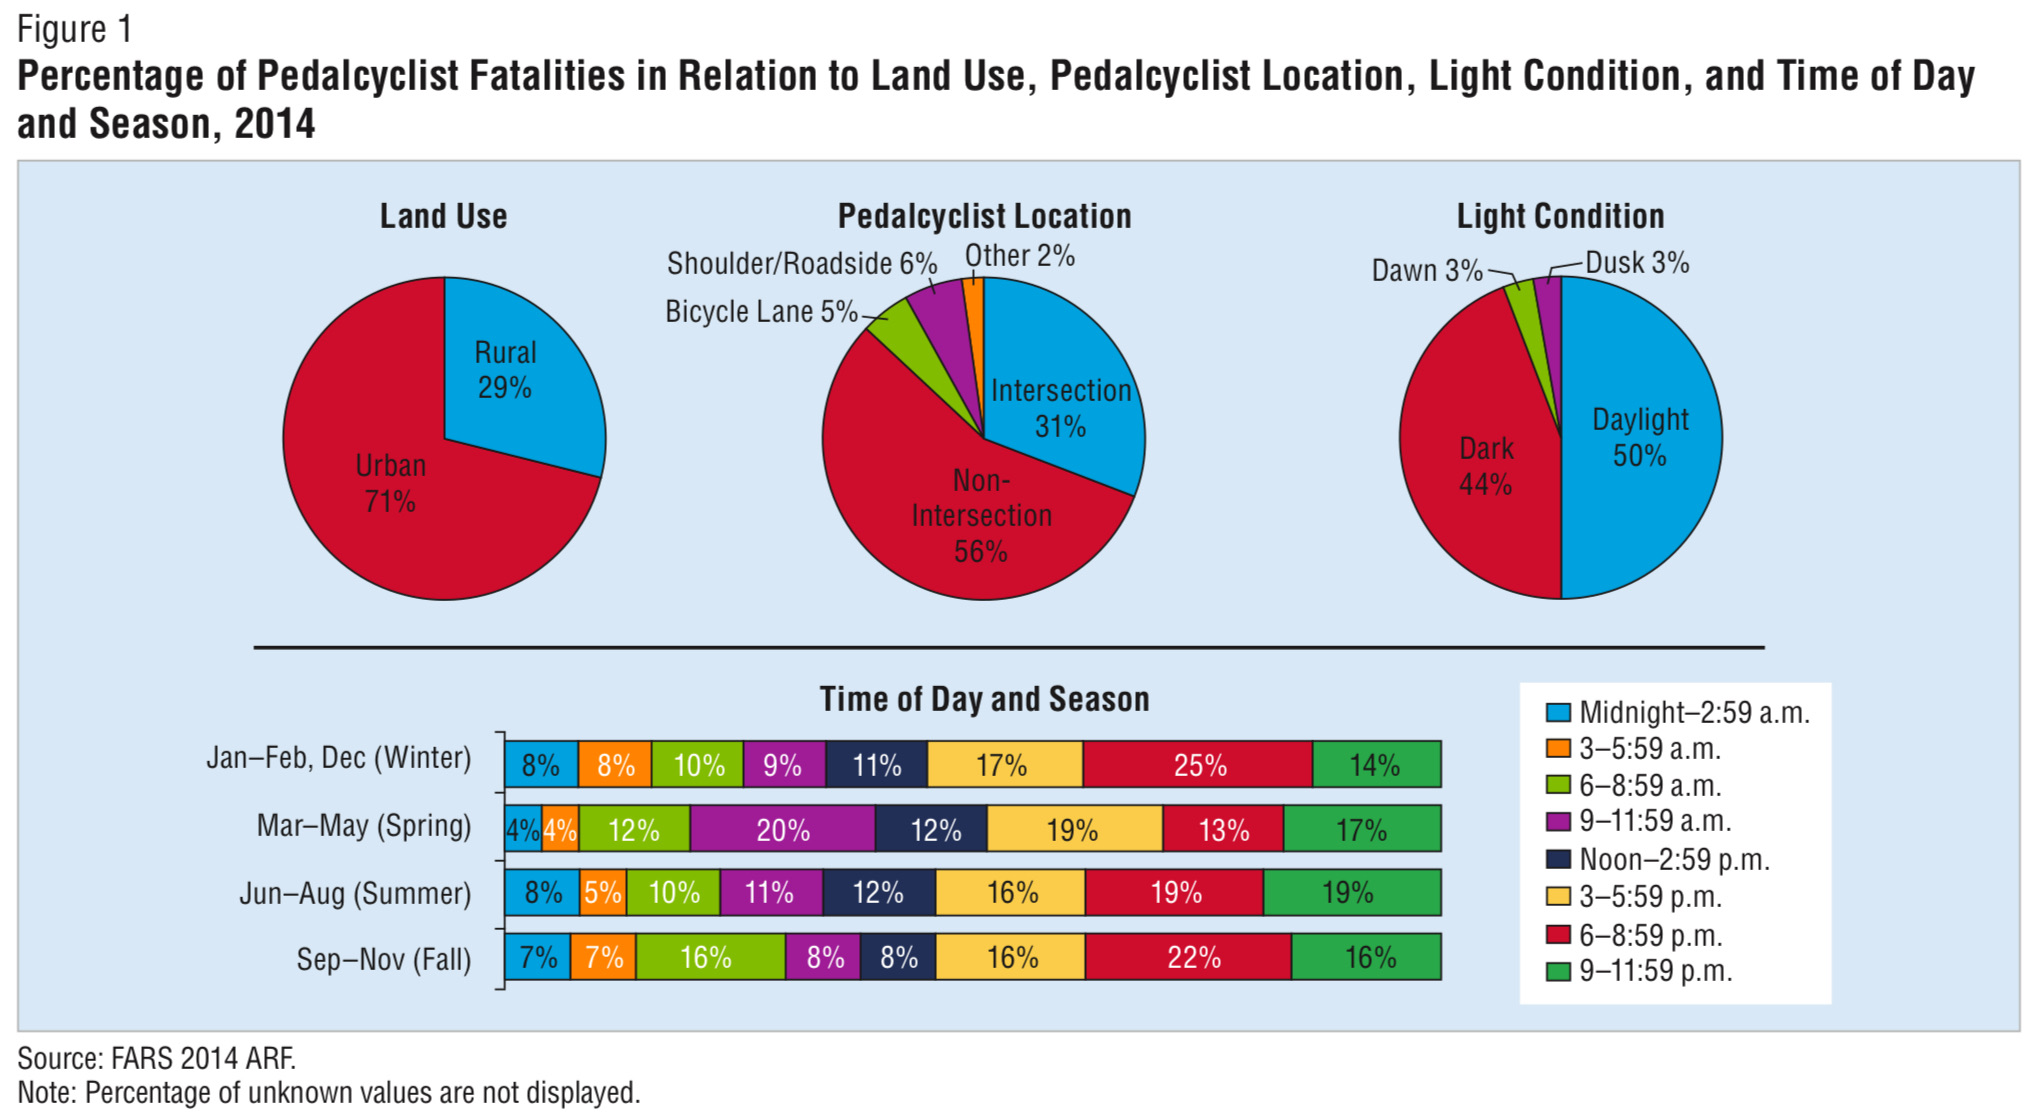
Hardly any fatal crashes happen between a bike and motorized vehicle in marked bike lanes. Also, 97% of cyclist fatalities involved a rider not wearing a helmet, and 74% of fatal crashes involved head injuries.
The average annual bicycle-commuting distance is 3100 kilometers, according to a survey. Just under 10% of respondents to this study reported an accident within the last 12 months of their response. An RDI, relative danger index where a higher number indicates greater danger, based on the data in the sample survey, for major streets were 1.26, minor streets were 1.04, streets with bikes lanes or routes were 0.50, bike paths were 0.67, and sidewalks were 5.30. The annual accident rate uncovered by the survey was 37.1 accidents per million kilometers of cycling.
Sharrows do not offer bike riders comfortable, dedicated space separated from motorized vehicle lanes.
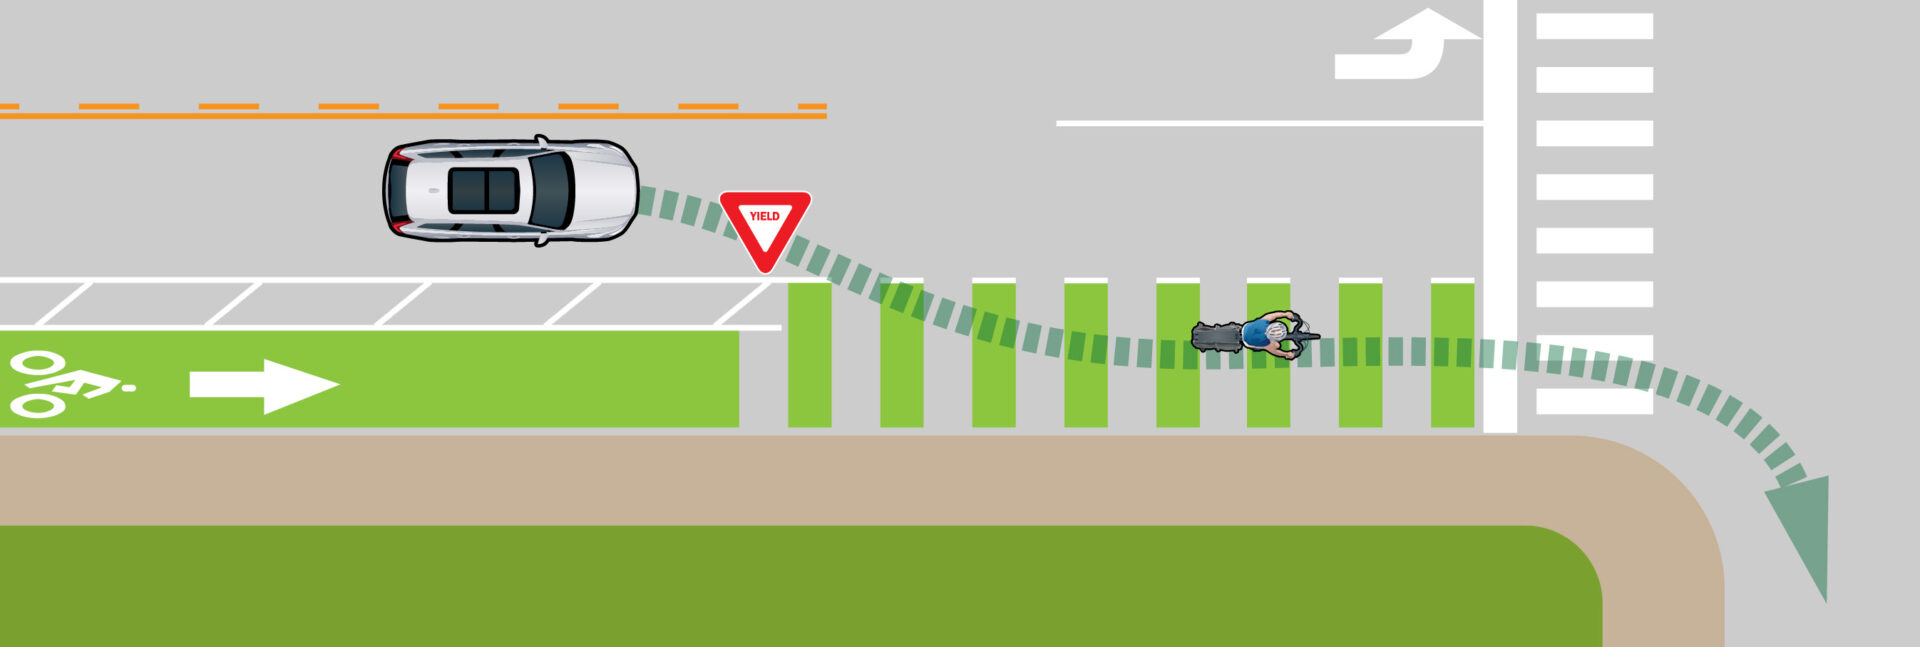
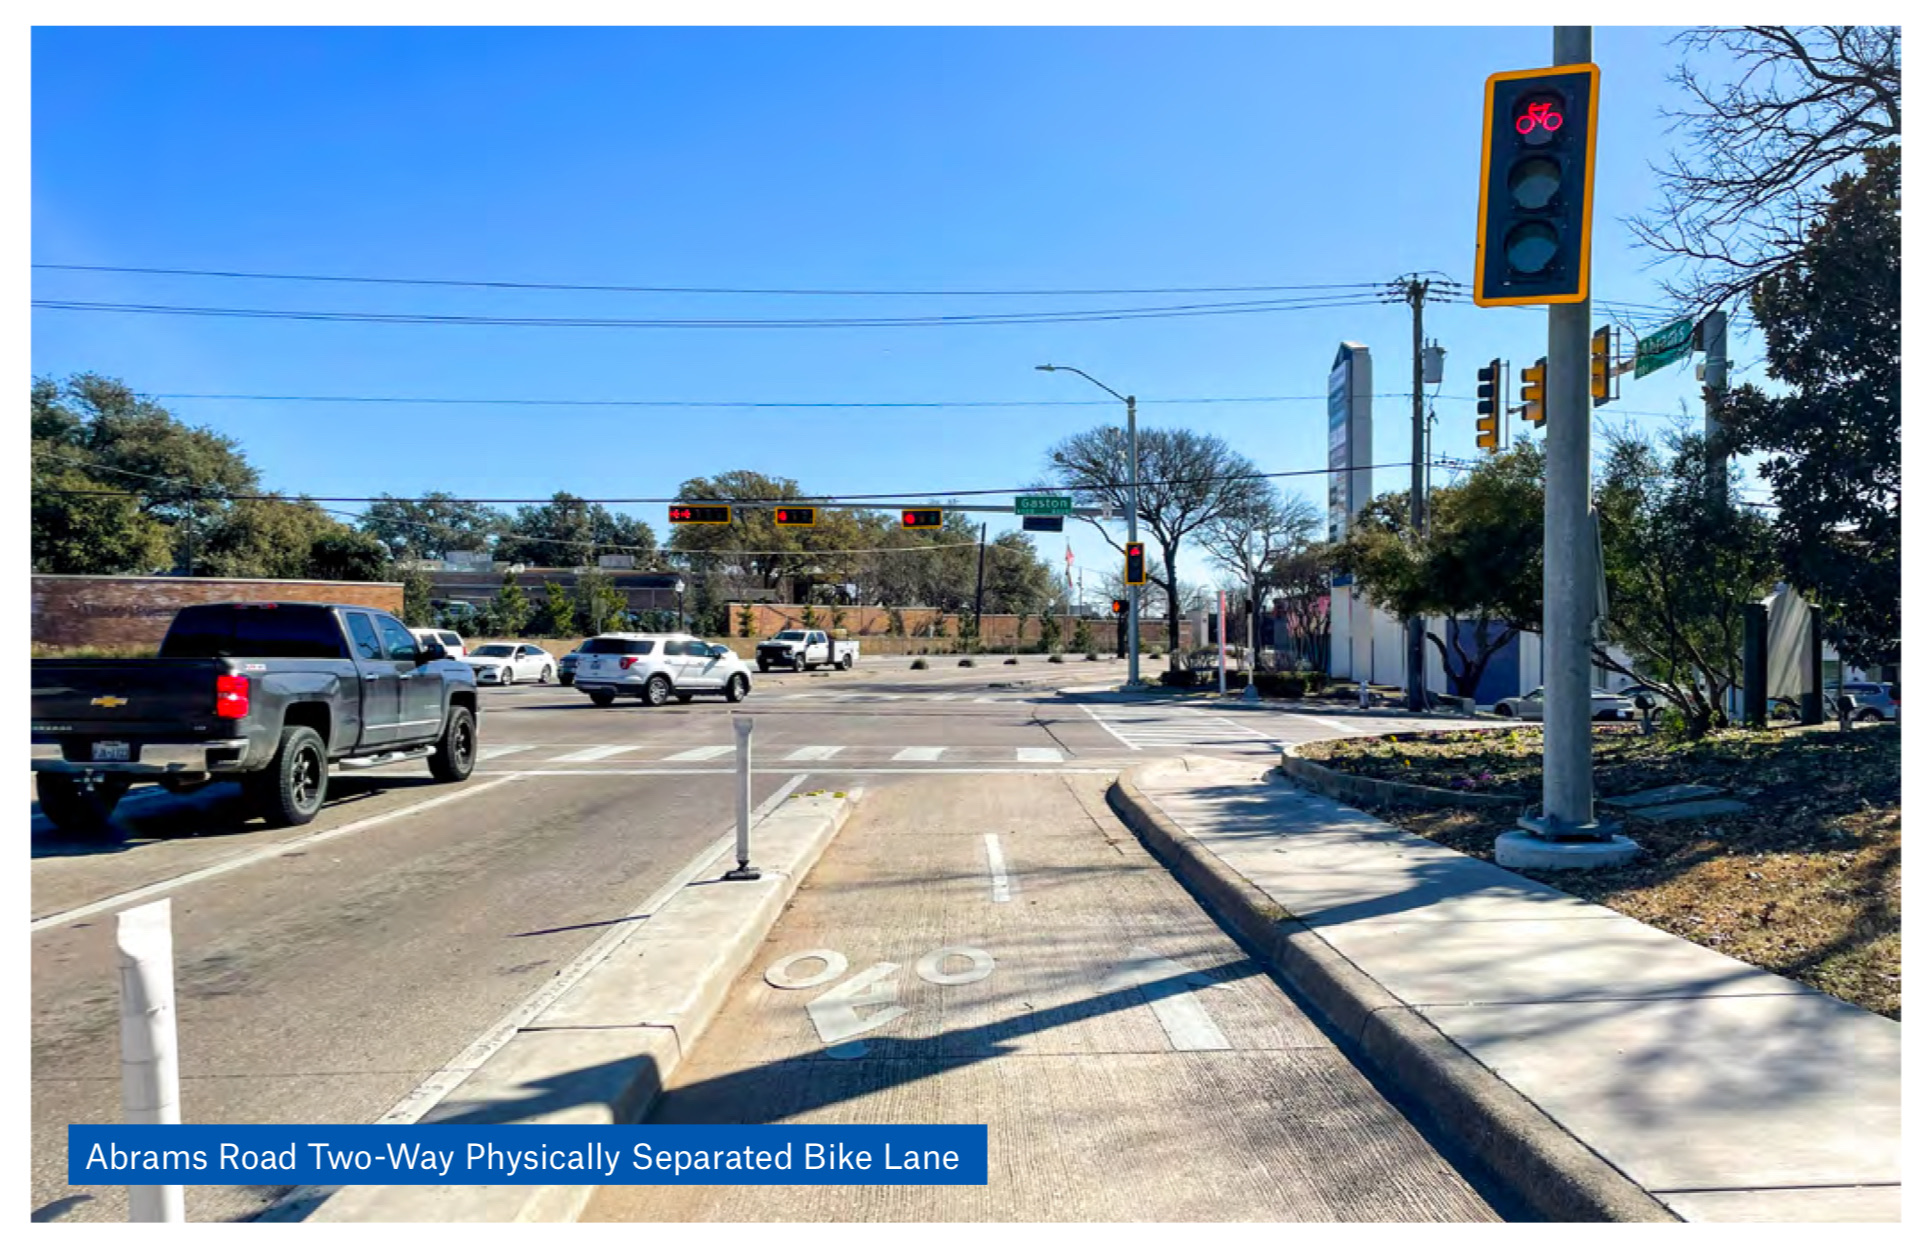
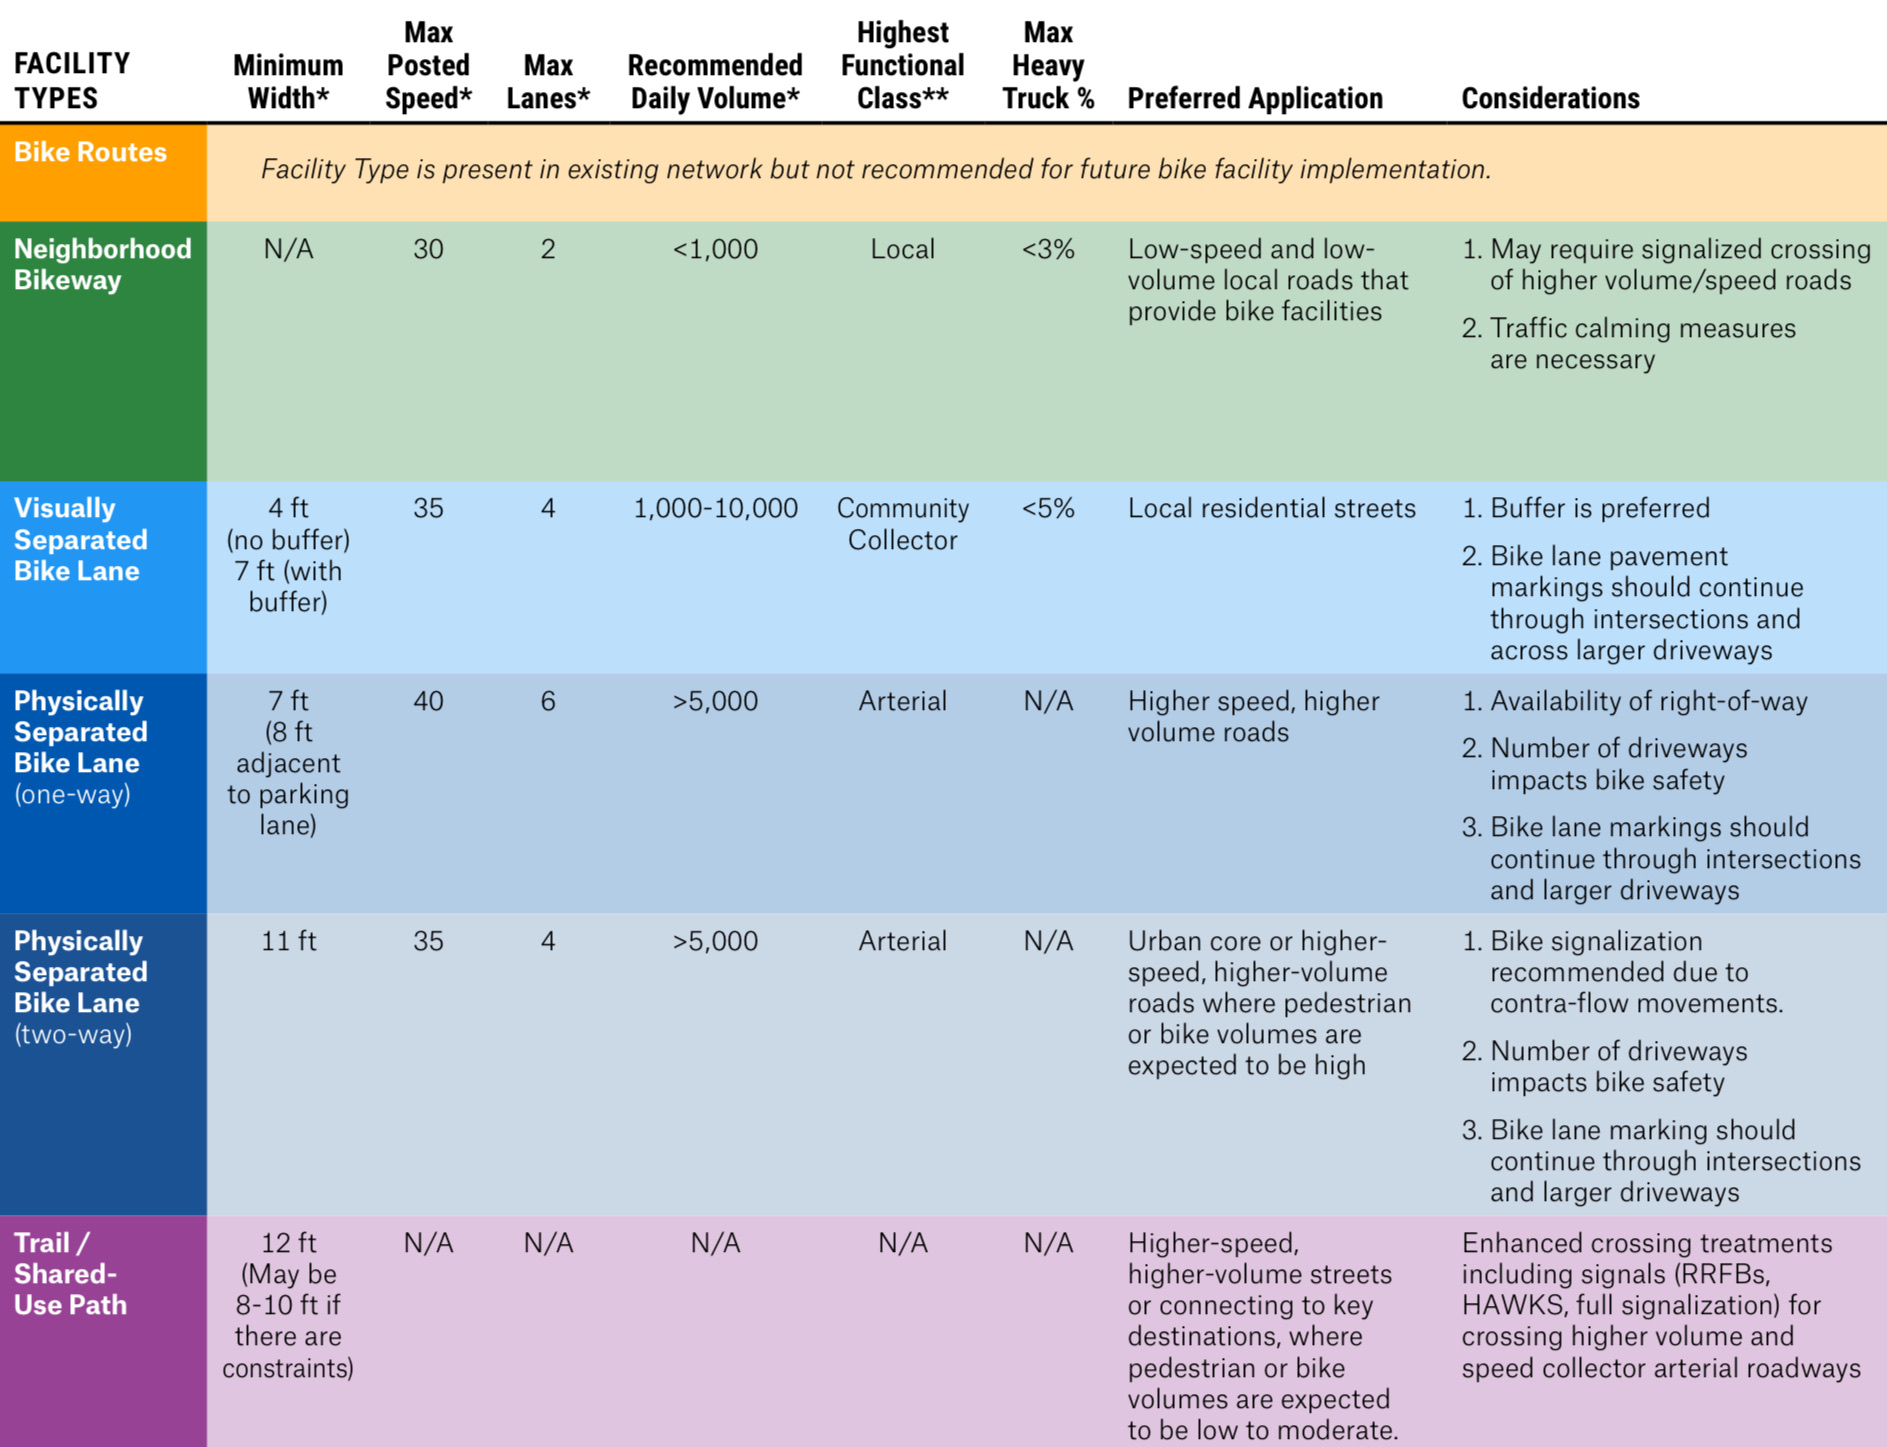
There are two types of bike lanes: visually separated and physically separated. Though physically separated bike lanes still designate a space only for cyclists, motorized vehicles can still access them, though it is not permitted. Physically separated bicycle lanes, however, completely separate cyclists and motorized vehicles, promoting safety and preventing accidents due to lack of awareness.
According to a 2007 study funded by the Heart and Stroke Foundation of Canada and the Canadian Institutes of Health Research, of 690 injured cyclists participating, the cyclists were mainly injured on less-than-five-kilometer-long, weekday, utilitarian purpose trips. Collisions injured 72% of participants.
Arris Composites' study in 2021 unearthed that Texas is among the least bike-friendly states, and Texas sits at the 32nd spot in the League of American Bicyclists' 2022 rankings. Texas's bicycle encouragement and education earned a C+, and funding and infrastructure scored a C, but traffic laws and practices earned a D-.
Studies show that bike lanes increase cycling and decrease the risk of injury and death. More cycling decreases systemic inequities in American transportation. Bike lanes improve visibility for cyclists and drivers, reducing accident risks due to lack of awareness or misjudgement; organize traffic and reduce congestion, allowing more predictable and safe conditions for all people on the road; provide a traffic calming effect; and increase ridership due to perceived safer conditions.
The presence of bike lanes can lead to reduced vehicle speeds, called a "traffic calming" effect, as suggested by studies. For example, a study found that a bike lane was associated with a 28% decrease in the average maximum speed on a street. Increasing opportunities for cyclists with bicycle lanes can help manage street capacity, potentially reducing traffic due to bike lanes providing an alternate means for transportation for short trips. However, adding bike lanes, especially protected lanes, could require a reallocation of road space, leading to more traffic, depending on the situation.
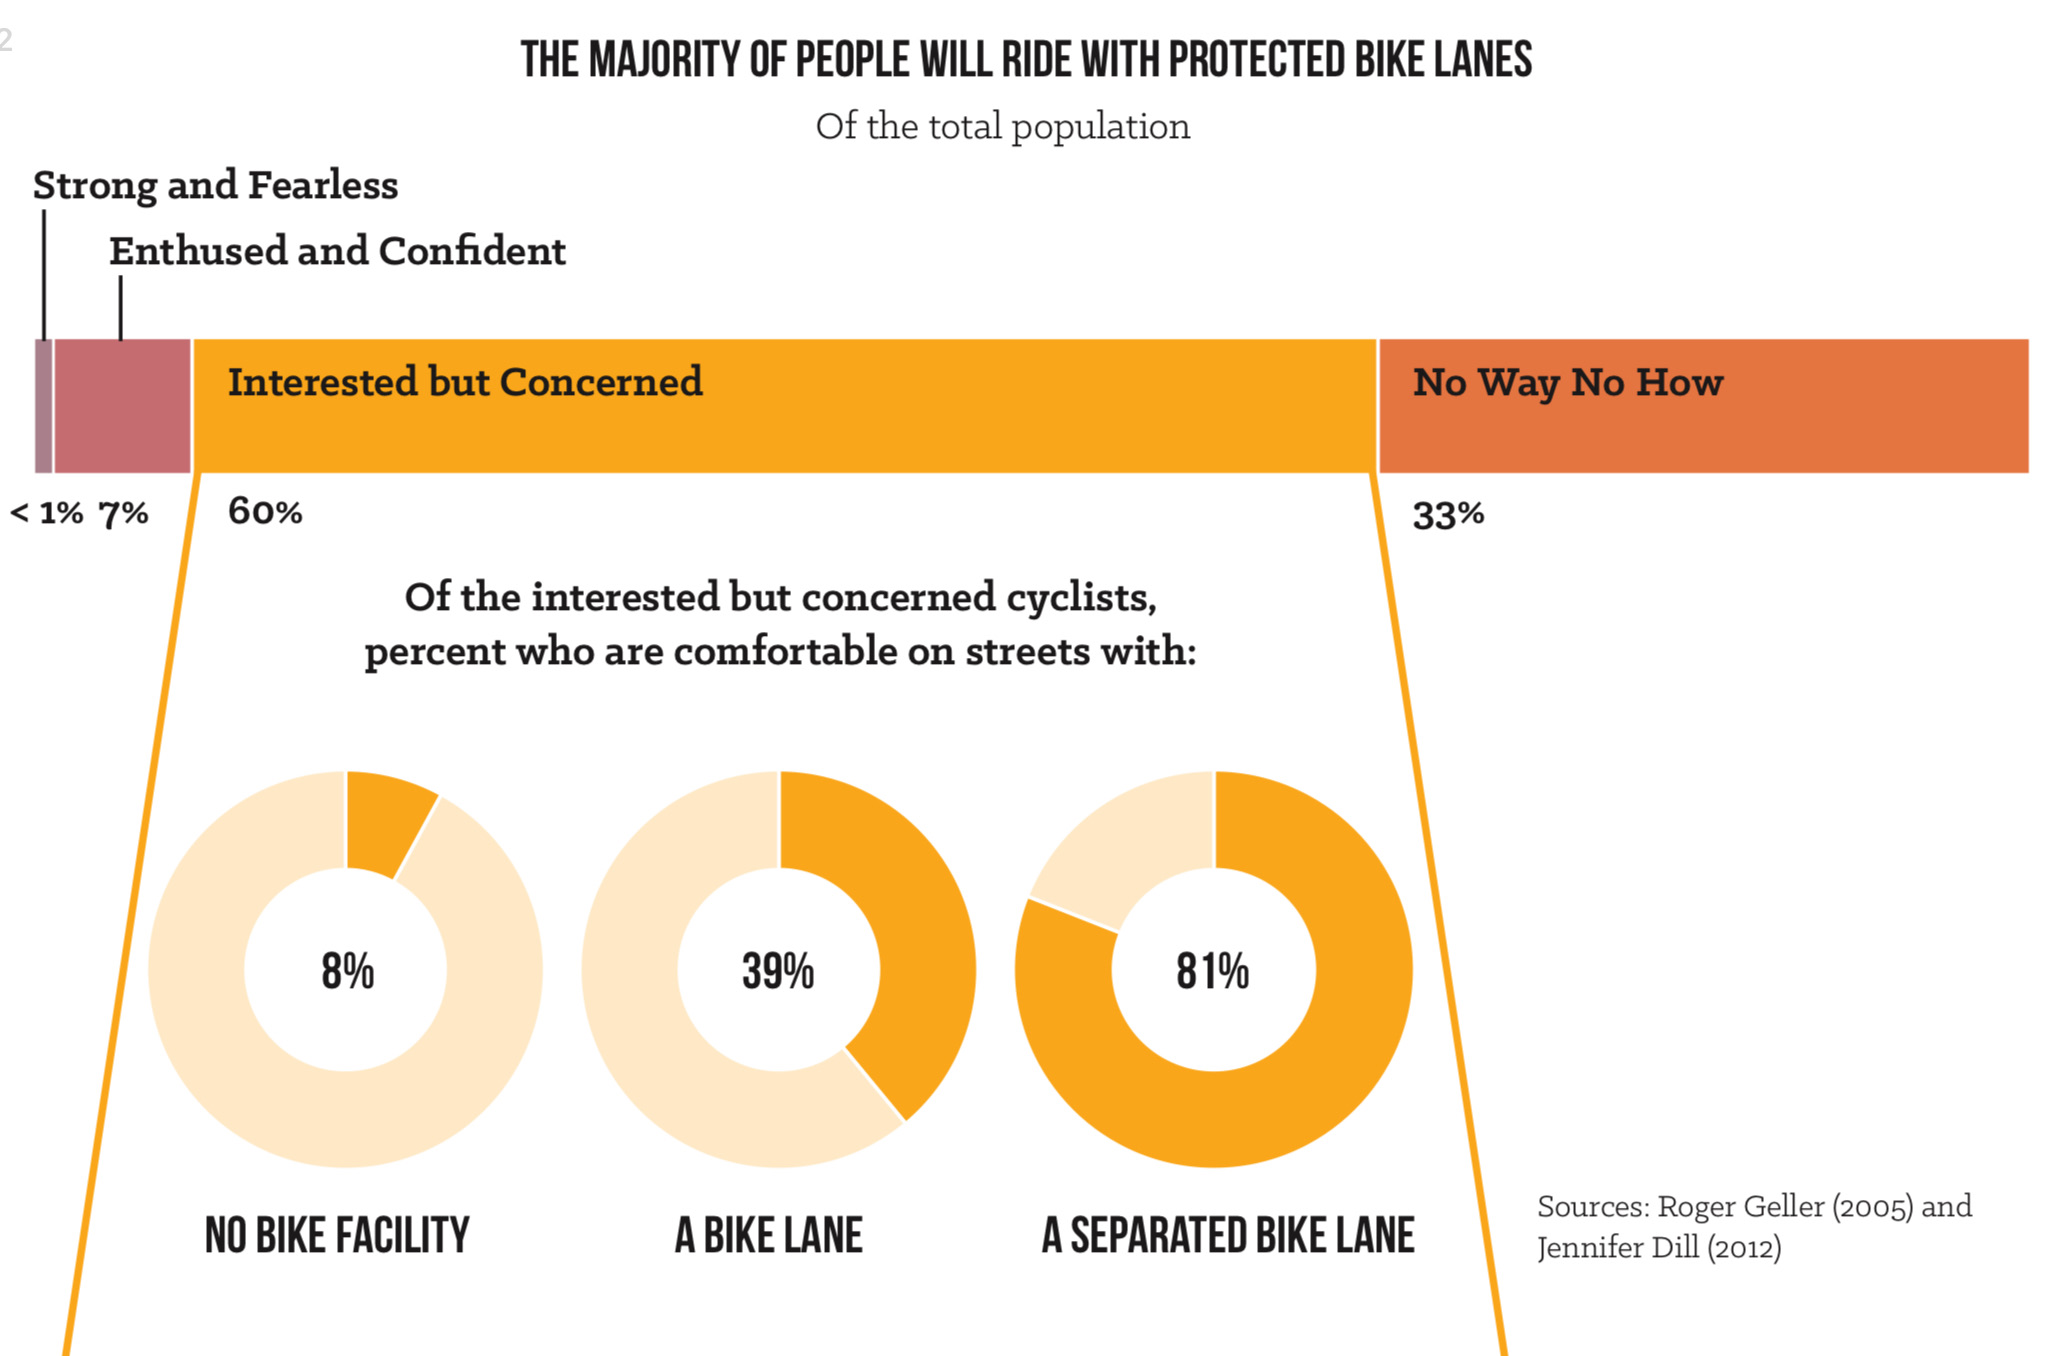
According to People for Bikes's 2015 national study, 54% of American adults find cycling a convenient way of transportation, and 51% want to ride more often, but 53% worry about accidents with motor vehicles. 47% of American adults say that they would more likely ride their bike if motorized vehicles such as cars and trucks drove separately from bikes.
Bicycles have many benefits. Apart from walking, they are both the most environmentally friendly form of transportation and the cheapest. This reduces carbon emissions and provides an alternative mode of transportation for low-income residents and those without a driver's license. They decrease traffic and housing prices because if people do not use cars or trucks, they do not take up space on the road and do not need a garage or driveway. Bike lanes are also cheaper to build compared to new traffic lanes on streets or roads. Cyclists also have healthier knees and cardiovascular systems and may live longer. Cycling is a low-impact way to exercise for older adults that can no longer take the strain on joints that jogging causes.
Cycling can diminish obesity, improve fitness, and reduce air pollution, greenhouse gases, and noise associated with travel. Unfortunately, cyclists have a higher risk of injuries requiring hospitalization than riders and drivers in motor vehicles. Making cycling safer can improve population health. A study demonstrated that infrastructure does influence both injury and crash risk while cycling. The presence of bicycle facilities had the lowest risk, whereas sidewalks and multi-use trails had the highest, suggesting that bicycle-specific facilities do reduce injuries and crashes.
Though cycling and walking work the same muscles, cycling tends to force the muscles to exert more force. So, cycling works muscles better than walking. Cycling also burns more calories compared to the same category of intensity of walking.
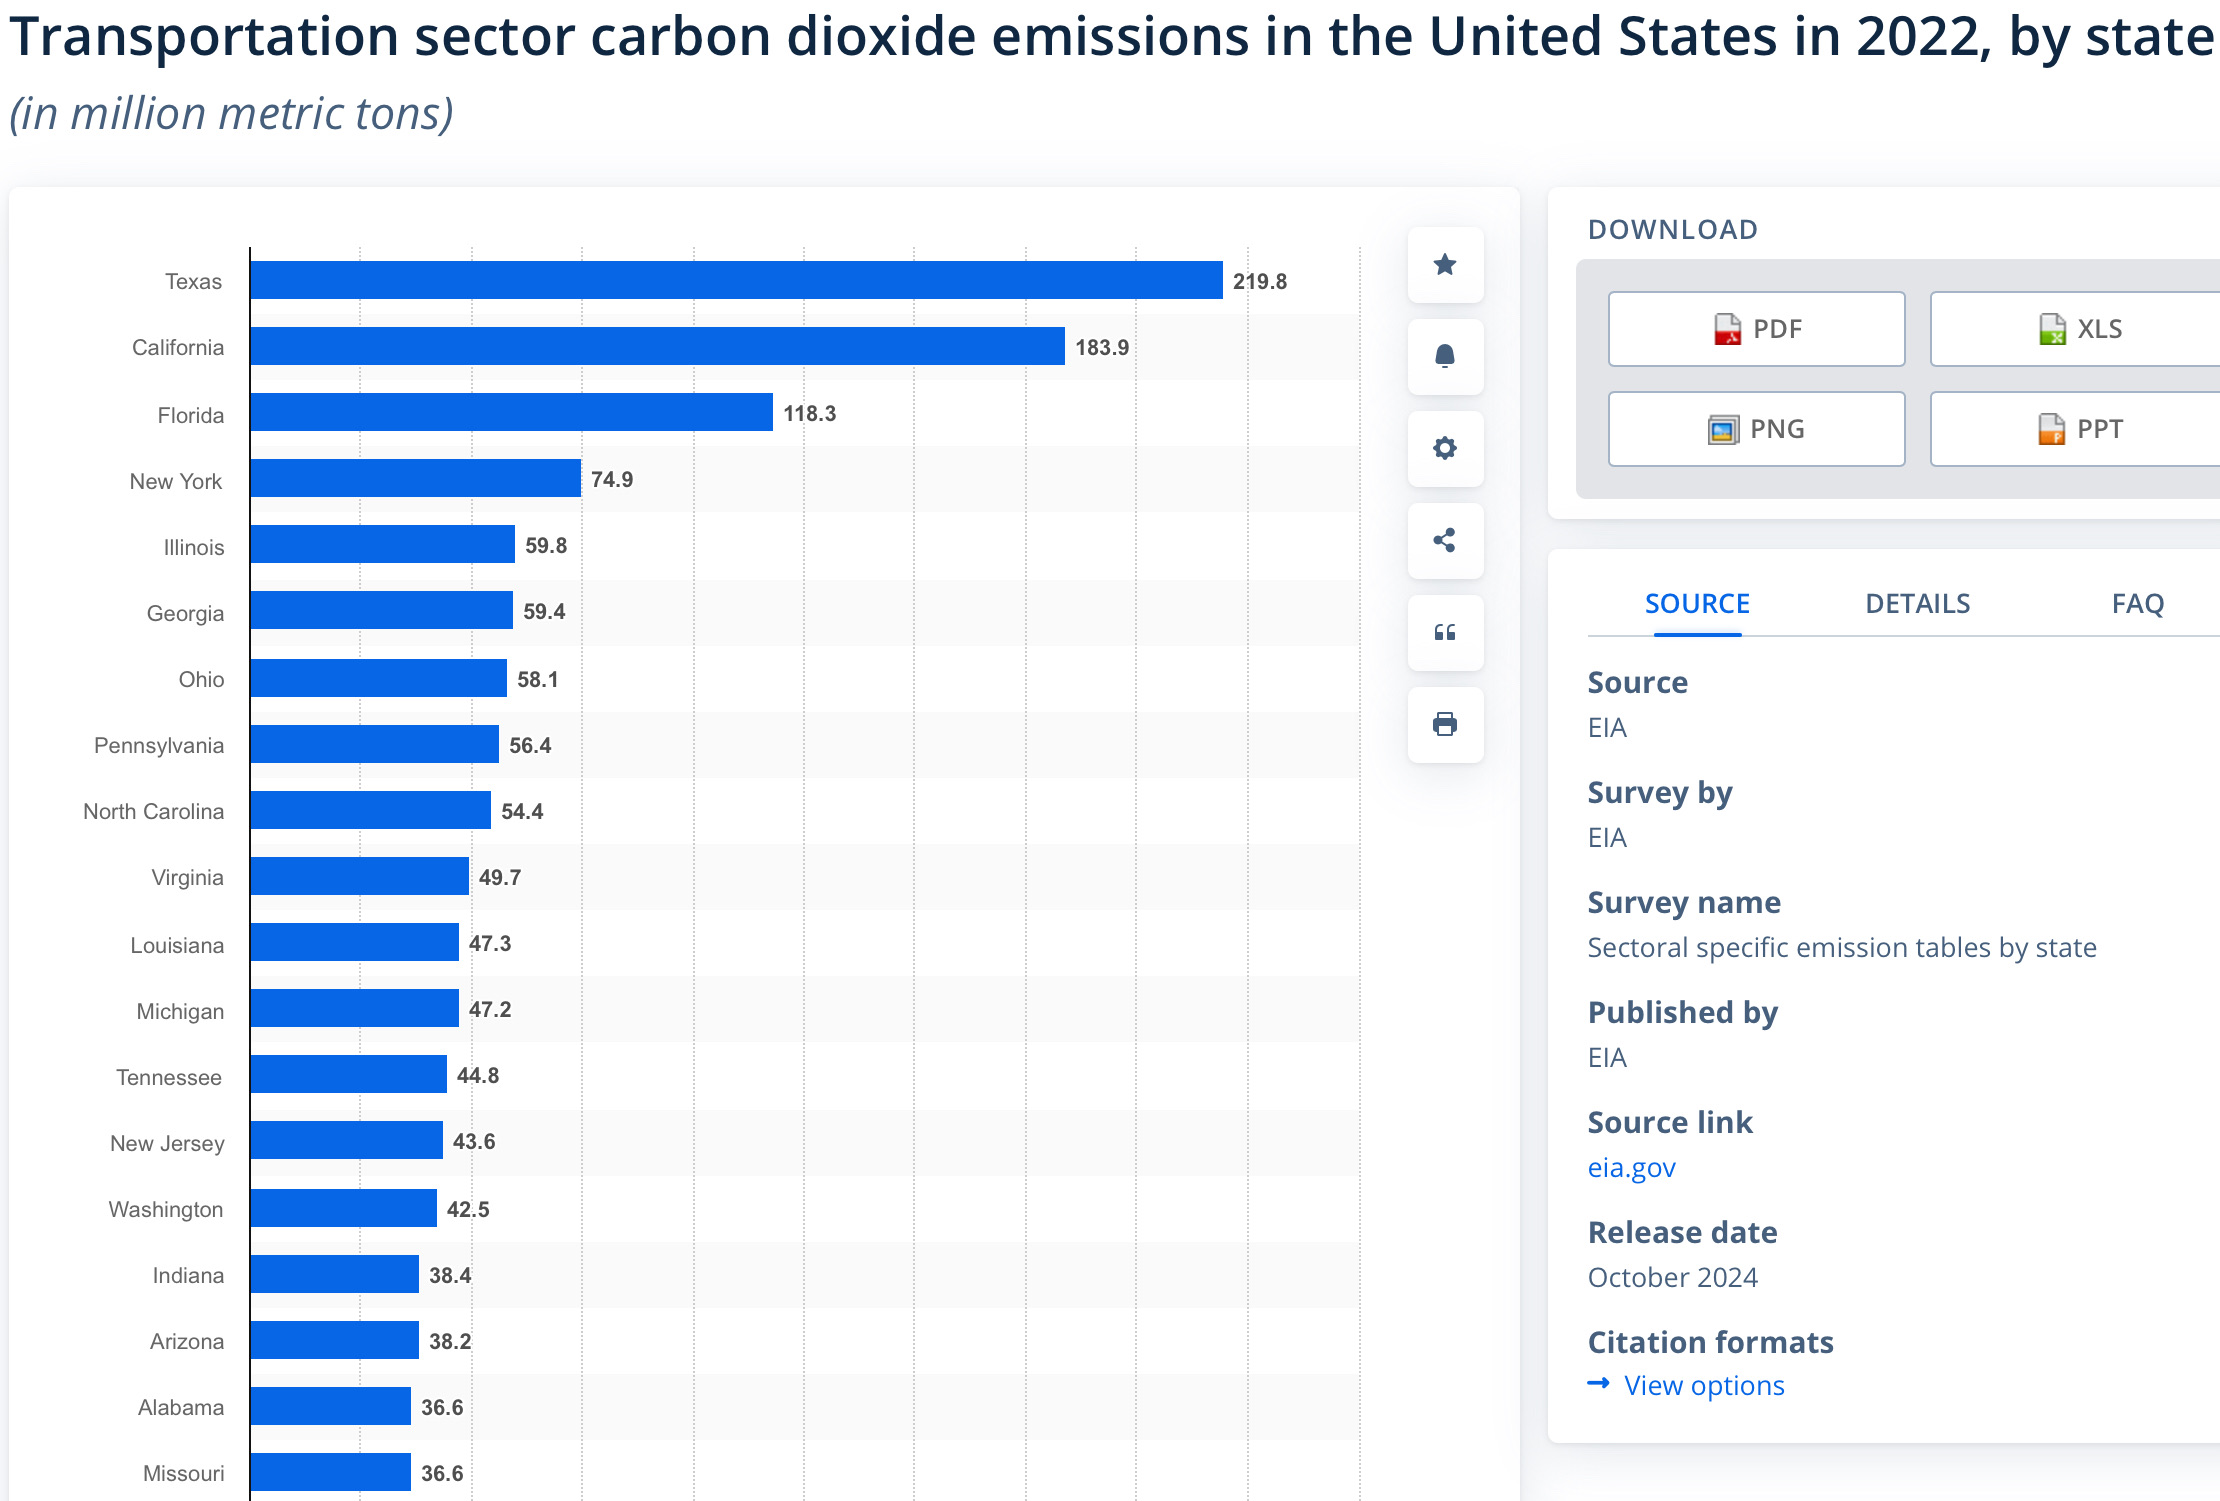
Texas leads the USA in transportation carbon dioxide emissions. In 2022, Texas produced almost 220,000,000 metric tons of carbon dioxide emissions just from transportation. Vehicles, especially passenger trucks and cars, contributed 83% of Texas's 2019 transportation emissions. Even though vehicle fuel efficiency improves, increase in vehicle use leads to higher rises of Texas transportation emissions. Increased cycling would decrease these carbon emissions because more people would be riding than driving.
Between 2019 and 2022, the American e-bike market surged 269% in sales. E-bikes are the most popular EV in the USA. Dallas allows the rental of e-bikes through a Shared Dockless Vehicle Program with companies such as Bird, Lime, and Spin; they were reintroduced in 2023 after a ban. Dallas is part of a Texas pilot program in 2025 that offers a $500 rebate for any e-bikes bought in non-attainment air quality zones, including the Dallas metropolitan area. Local e-bike stores exist in the Dallas area such as Electric Avenue Bikes, Bike Mart, and Pedego Dallas Electric Bikes. E-bikes are popular due to their increased performance and efficiency when compared to non-electric bikes; adaptability for leisure, commute, and work such as delivery; and lower cost compared to other transportation. There are three types of e-bikes: Class 1, Class 2, and Class 3. All three fall under the basic definition of an e-bike: a bike with operational pedals equipped with a fewer-than-750-watt electric motor with a top assisted speed of less than or equal to twenty-eight miles per hour. They share the same rules as bikers regarding traffic and the requirements of a horn, headlight, and taillight. A Class 1 e-bike assists until it reaches twenty miles per hour, or the rider stops pedalling. A Class 2 e-bike assists until it reaches twenty miles per hour but does not have to stop if the rider does not pedal. A Class 3 e-bike assists until it reaches twenty-eight miles per hour, or the rider stops pedalling.
Texas requires children under 18 years of age to wear a bicycle helmet whilst riding a regular bicycle or Class 3 e-bike. However, Class 1 and 2 e-bikes are helmet optional for people of all ages.
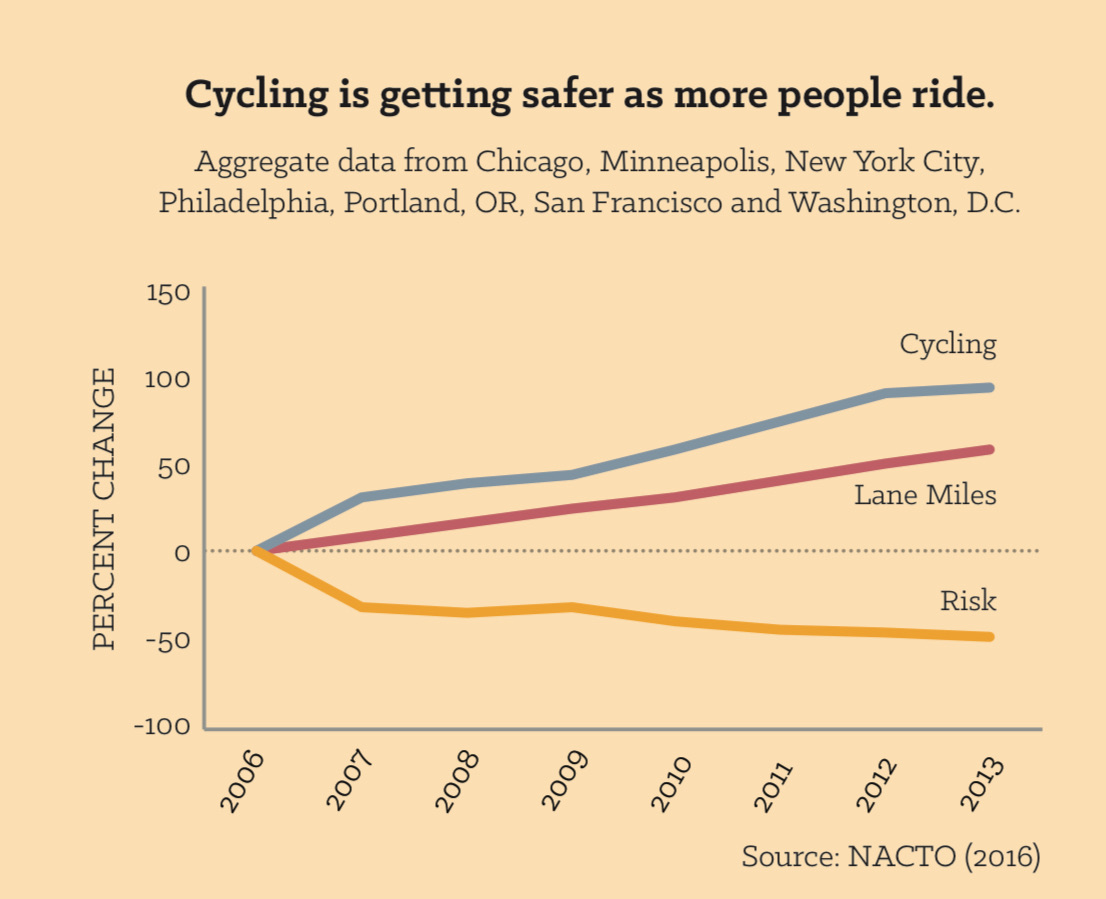
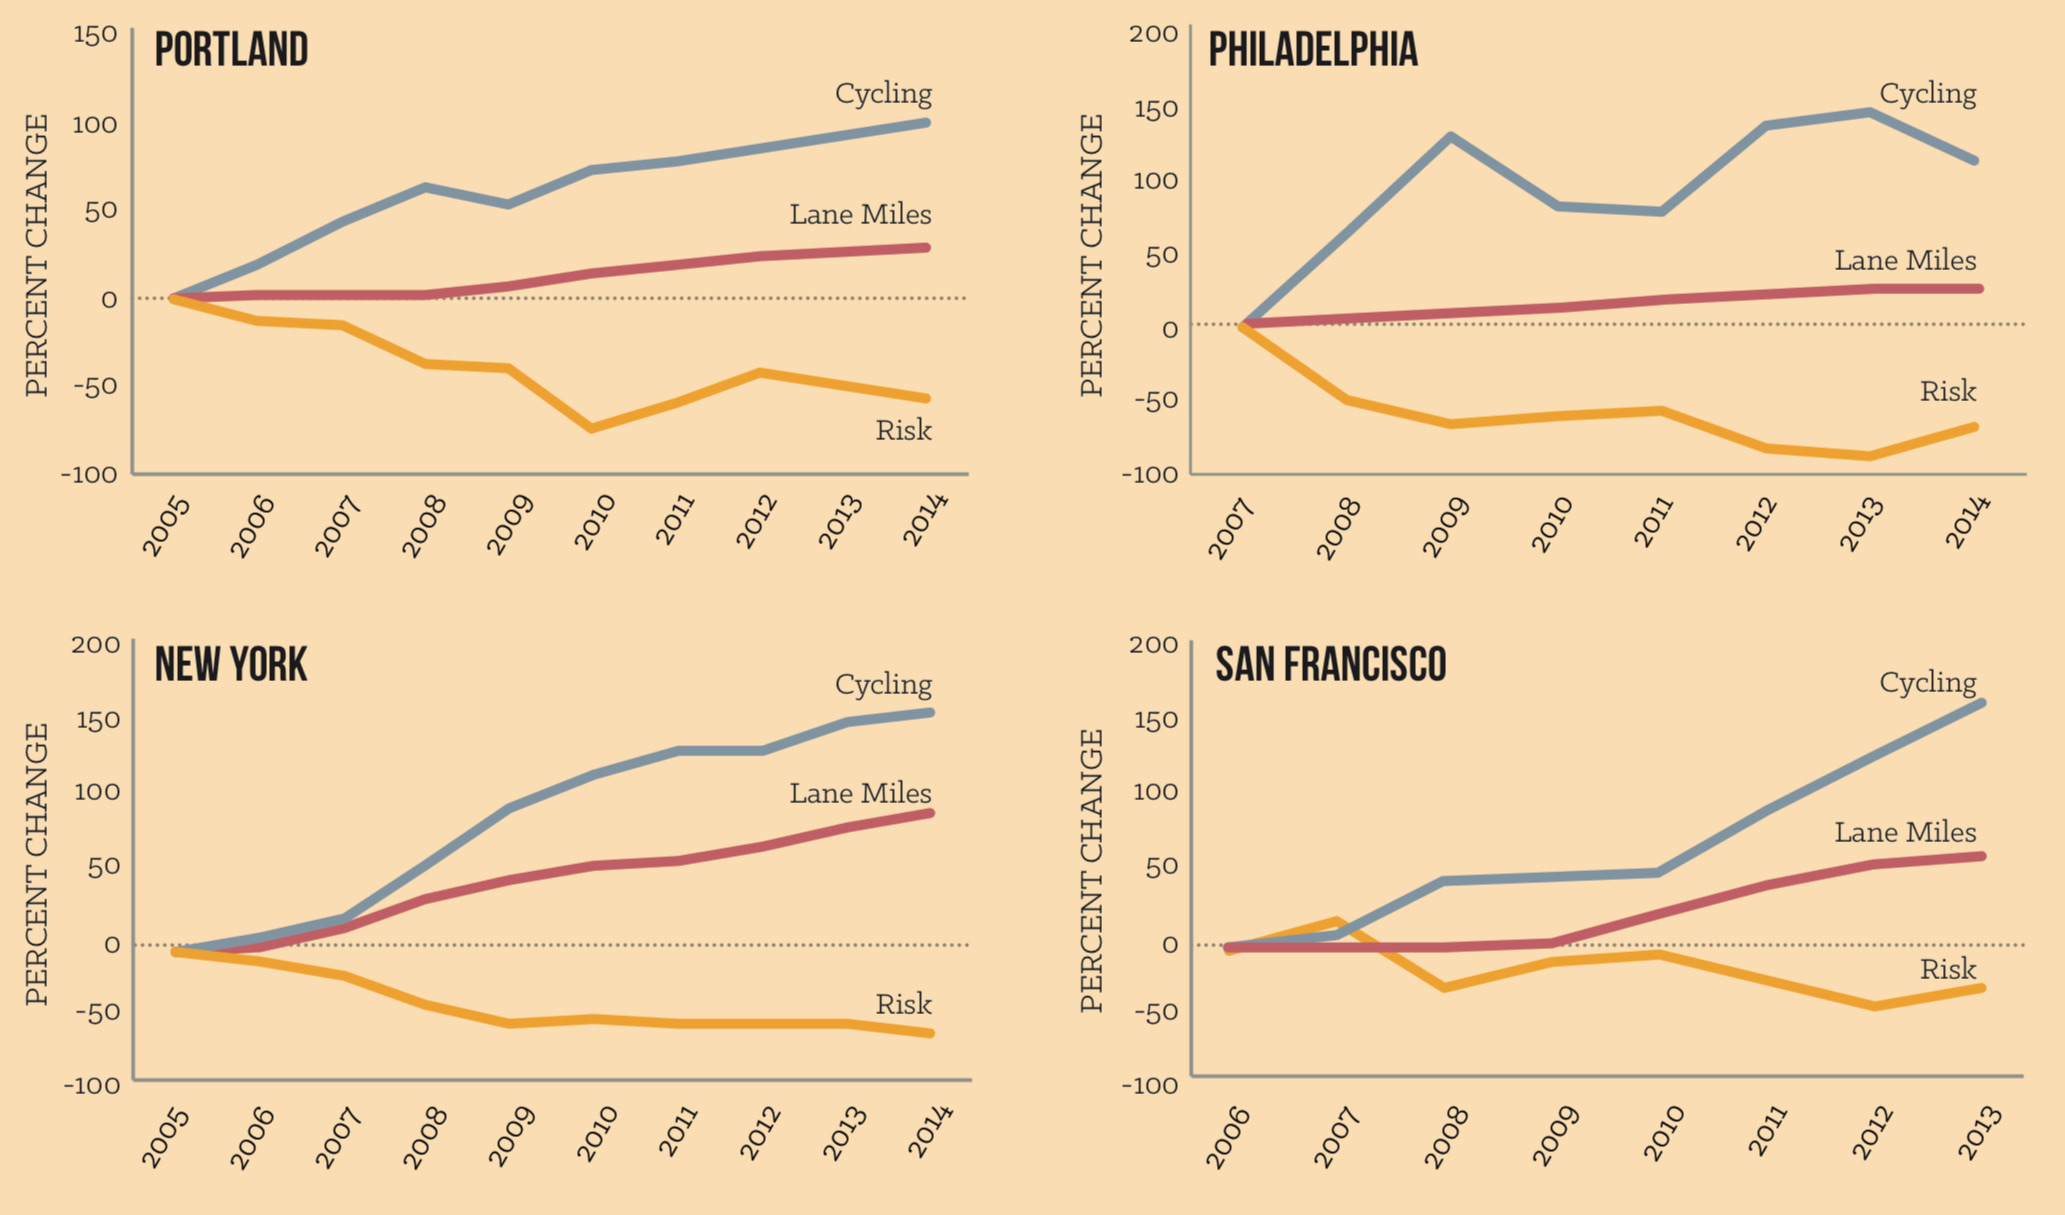
A NACTO study showed that the more cyclists there are in a city, the more the bike lane system expands, improving safety for riders and therefore encouraging more people to bike. This positive feedback loop promotes public health through exercise and biking safely.
Public engagement was a major factor in the City of Dallas's ability to update the Dallas Bike Plan. Community involvement is crucial to address bike travel concerns.
Bibliography
https://ehjournal.biomedcentral.com/articles/10.1186/1476-069X-8-47https://pubsindex.trb.org/view.aspx?id=578182
https://www.peoplepoweredmovement.org/dallas-roads-analyzing-infrastructure-and-cycling-incident/
https://www.bikelegalfirm.com/texas-bicycle-accident-laws
https://crashstats.nhtsa.dot.gov/Api/Public/ViewPublication/812282
https://www.nyc.gov/html/dot/downloads/pdf/bicyclefatalities.pdf
https://dallaslibrary2.org/government/cycling.php
https://nacto.org/wp-content/uploads/NACTO_Equitable_Bikeshare_Means_Bike_Lanes.pdf
https://dallascityhall.com/departments/transportation/bikeway/DCH%20Documents/pdf/Texas_Bike_Laws.pdf
https://dallascityhall.com/departments/transportation/bikeway/Pages/bicycle-safety.aspx
https://www.tceq.texas.gov/airquality/areasource/emissions-sources-charts
https://dallascityhall.com/departments/transportation/bikeway/Documents/DallasBikePlan2025_digital.pdf
https://www.healthline.com/health/fitness/cycling-vs-walking#bottom-line
https://www.tandfonline.com/doi/full/10.1080/15568318.2012.673694?needAccess=true
https://www.pexels.com/photo/bicycle-lane-in-a-road-11268828/